How We Measure Similarity
Factor scores
We rely on a series of explorative factor analyses (EFAs) to extract similarities among ROs. Similarity could be established purely inductively, by using popular indices such as the Jaccard index which looks at the percentage of identically coded items (Alschner and Skougarevskiy 2016), or measures of dispersion as proxies for convergence (see Heichel, Pape, and Sommerer 2005). Similarity could also be established purely deductively, by developing a concept, such as delegation and pooling, and evaluating how similar ROs are regarding the specific items establishing each concept (Hooghe and Marks 2015). Factor analysis has several advantages over these two approaches, all of which serve the general goals of CROP.
EFA establishes similarity by summarizing the data and looking for distinct structures in it. Data summarization is achieved by identifying the fewest possible constructs needed to reproduce the original data (Gorsuch 1997, 533; Hair et al 2019, 129) The factors, which are extracted through a correlation analysis of variables might just represent correlations among response items, but if there is a conceptual basis for understanding the relationships between the variables, the dimensions may actually ‘have meaning for what they collectively represent’ (Hair et al. 2019, 130). They can represent specific social constructs common to all ROs.
The ‘factors’ produced by an EFA are directly linked to the original data. Because EFA is an inductive technique, the constructs are manifestly grounded in the empirical data (see also: Coppedge, Alvarez, and Maldonado 2008). The desired result is that all variables measuring the same construct are scored together to give the best estimate of each RO’s score on that construct (Gorsuch 1997, 533). That way, EFA provides what Bendix (1963) calls ‘intermediate concepts’: Concepts that are not as abstract as the general concepts, such as authority, autonomy or independence, or delegation and pooling (Lindberg 1970; Haftel and Thompson 2006; Bradley and Kelley 2008; Hooghe and Marks 2015), but more general than the characteristics of any single regional organization (Bendix 1963).
Dimensions of Treaties
Interpretation
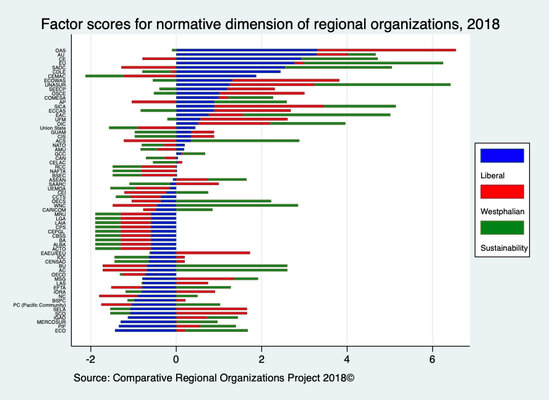
The figure below shows how specific organizations score on the three dimensions of norms. The factor scores are standardized, so that
0 indicates an average score of the dimension
negative values a below average score, and
positive values an above average score.
The substantive meaning of the scores is that an organization has more or less items of the dimension included in its agreements. The organizations are sorted by their score for the liberal norms dimension (in blue).


